Dapper: a Large-Scale Distributed Systems Tracing Infrastructure
What is Dapper?
Dapper is Google's distributed tracing system that helps engineers understand what's happening in their large-scale applications. Think of it like a GPS tracker for requests flowing through Google's systems - it shows exactly where a request goes, how long each step takes, and where problems occur.
Why Was It Needed?
Modern web services like Google Search are built from hundreds of different software components, often written by different teams in different programming languages, running across thousands of machines worldwide. When something goes slow, engineers face a nightmare: which of these hundreds of services is causing the problem?
Before Dapper, an engineer might see that search is slow, but have no way to pinpoint whether the problem is in the web server, the search index, the ads service, the spell-checker, or somewhere else entirely. It's like trying to find a traffic jam in a city by only knowing that people are arriving late to their destinations.
Abstract
Modern Internet services are often implemented as complex, large-scale distributed systems. These applications are constructed from collections of software modules that may be developed by different teams, perhaps in different programming languages, and could span many thousands of machines across multiple physical facilities. Tools that aid in understanding system behavior and reasoning about performance issues are invaluable in such an environment. Here we introduce the design of Dapper, Google's production distributed systems tracing infrastructure, and describe how our design goals of low overhead, application-level transparency, and ubiquitous deployment on a very large scale system were met. Dapper shares conceptual similarities with other tracing systems, particularly Magpie [3] and X-Trace [12], but certain design choices were made that have been key to its success in our environment, such as the use of sampling and restricting the instrumentation to a rather small number of common libraries. The main goal of this paper is to report on our experience building, deploying and using the system for over two years, since Dapper's foremost measure of success has been its usefulness to developer and operations teams. Dapper began as a self-contained tracing tool but evolved into a monitoring platform which has enabled the creation of many different tools, some of which were not anticipated by its designers. We describe a few of the analysis tools that have been built using Dapper, share statistics about its usage within Google, present some example use cases, and discuss lessons learned so far.
Introduction
The core problem is simple but difficult: an engineer looking only at the overall latency (response time) may know there is a problem, but may not be able to guess which service is at fault, nor why it is behaving poorly.
Dapper's Design Goals
To be useful at Google's scale, Dapper needed two fundamental capabilities: ubiquitous deployment (working everywhere) and continuous monitoring (always running). These requirements led to three concrete design goals:
-
Low overhead: The tracing system can't slow down the applications it's monitoring. Even a 1% slowdown across all of Google's systems would be unacceptable.
-
Application-level transparency: Developers shouldn't need to add tracing code to their applications. Why? Because a system that relies on developers manually adding tracing will inevitably have gaps - someone will forget, or make mistakes, or not know they need to do it. This would defeat the goal of ubiquitous deployment.
-
Scalability: The system must handle tracing across Google's entire infrastructure - billions of requests per day across millions of lines of code.
How Dapper Achieved These Goals
Application-level transparency was the trickiest goal. Dapper achieved it by modifying only a small set of common libraries that almost every Google service uses - specifically, the RPC (Remote Procedure Call) library that handles communication between services, and some threading libraries. This required just about 1,500 lines of C++ code. By instrumenting these core libraries instead of individual applications, Dapper automatically traces any service that uses them.
Scalability and low overhead were achieved through adaptive sampling - a clever insight that you don't need to trace every single request to understand system behavior. Dapper found that sampling just one out of every thousand requests (or even one in sixteen thousand for very high-traffic services) provides sufficient information for debugging most issues. This dramatically reduces the data volume and processing overhead.
An unexpected benefit: Dapper evolved beyond just a monitoring tool into a platform that enabled teams to build their own custom analysis tools, many of which the original designers never anticipated.
How Distributed Tracing Works in Dapper
Understanding Traces and Spans
Think of a trace as the complete story of a single request's journey through Google's systems. When you search for "restaurants near me," that one search might touch dozens of services, and the trace captures all of them.
A span is one chapter in that story - it represents a single unit of work, like one service calling another service. Each span records:
- When it started and ended
- How long the communication took
- Optional notes (annotations) that developers can add for debugging
All spans that belong to the same request share a common trace ID, which is how Dapper knows they're part of the same story. The spans form a tree structure: the initial request is the root, and each subsequent service call becomes a child node.
What Gets Recorded
-
Automatic data: Span start/end times and RPC timing are automatically recorded by Dapper's instrumentation in the RPC library - developers don't have to do anything.
-
Optional annotations: Developers can add custom notes to spans if they want extra debugging information. To prevent people from accidentally logging too much data (which could overwhelm the system), each span has a configurable size limit. Developers can add simple text notes, key-value pairs, counters, or even binary data. Surprisingly, 70% of all Dapper spans and 90% of all traces include at least one developer-added annotation.
-
Multi-host spans: A single span can contain information from multiple machines. In fact, every RPC span includes data from both the client (the service making the call) and the server (the service receiving it), making two-host spans the most common type.
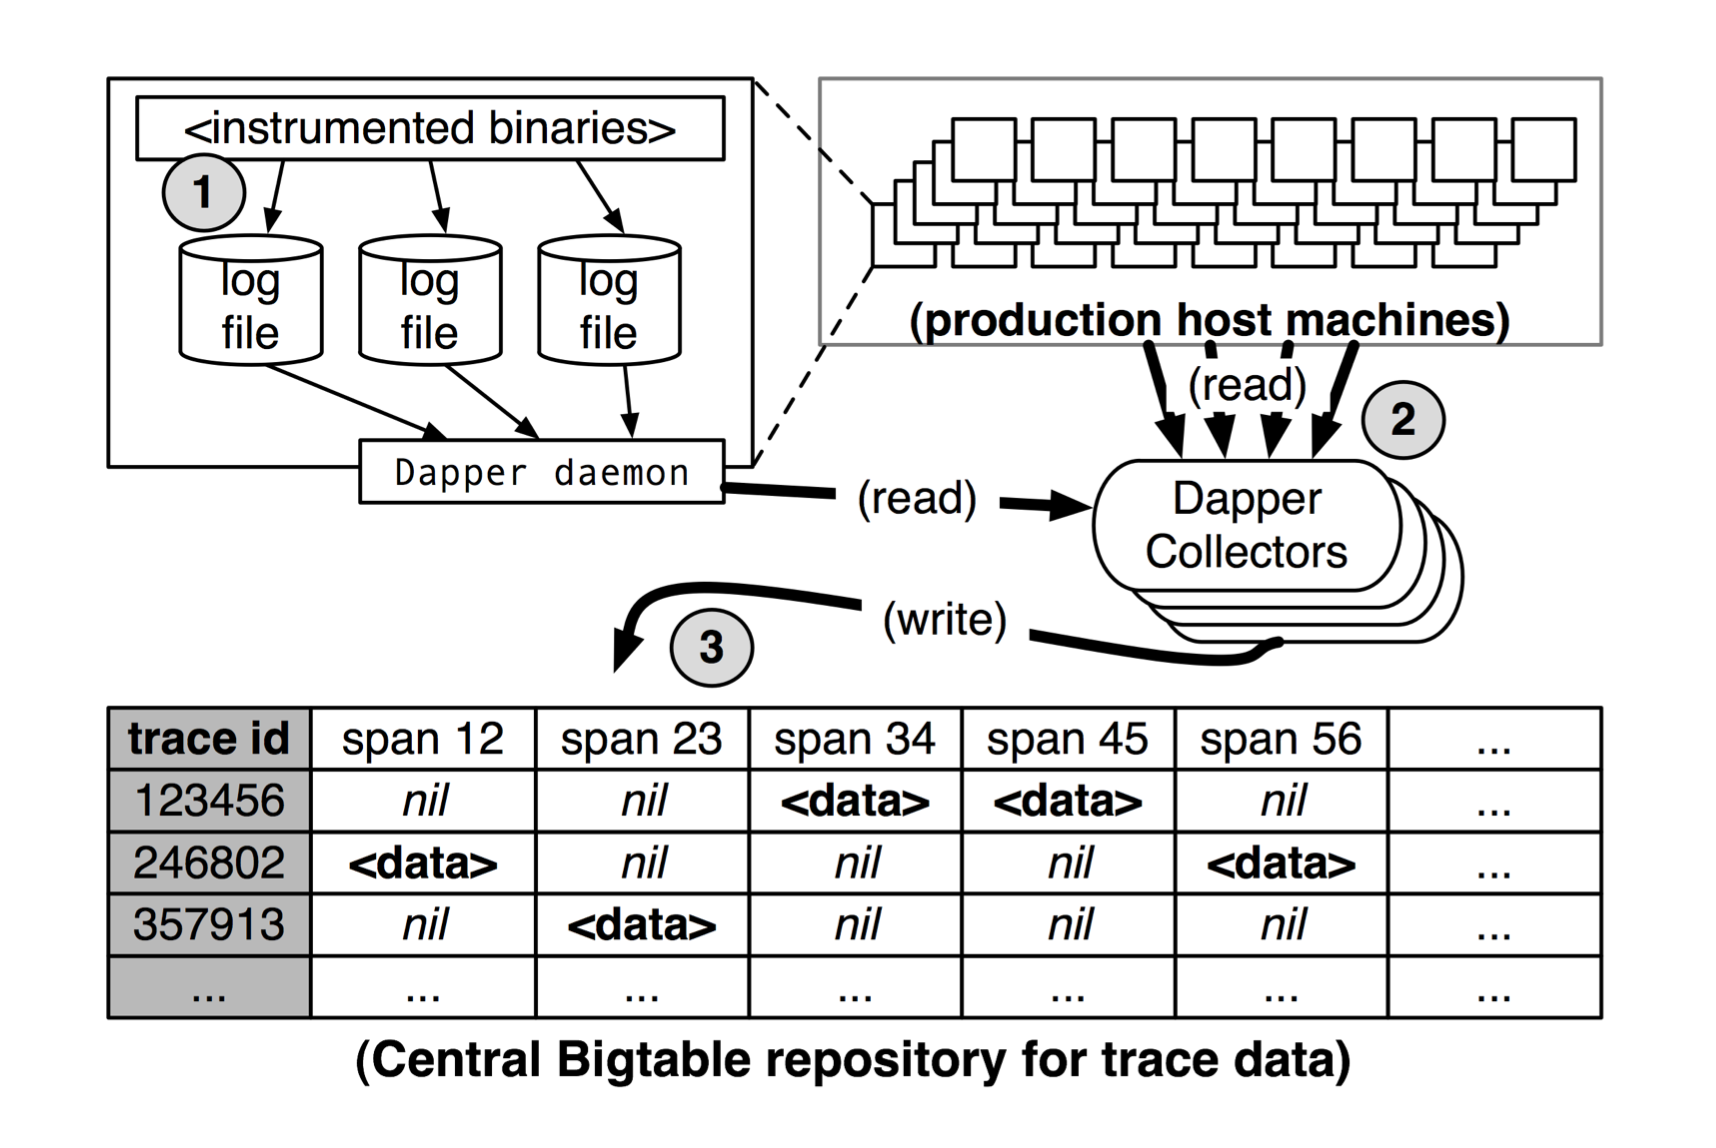
How Trace Data is Collected
The collection pipeline works in three stages:
- Span data is first written to local log files on each machine
- Dapper background daemons (helper processes) pull this data from all production machines
- The data is finally stored in regional Dapper Bigtable repositories (Google's large-scale database system)
This happens fast: the median time from when an event occurs to when it appears in the central repository is less than 15 seconds. In 75% of cases, even the 98th percentile (the slowest 2%) is under two minutes, though occasionally it can take several hours during system issues.
Privacy and Security
Dapper records the names of RPC methods (like "SearchIndex.Query" or "AdService.GetAds") but deliberately does not log the actual data being sent. This protects user privacy and sensitive information. If teams need to log specific data for debugging, they can use the annotation mechanism to explicitly opt-in.
General-Purpose Dapper Tools
To make Dapper useful for thousands of engineers, Google built a comprehensive set of tools on top of the tracing infrastructure:
-
The Dapper Depot API (DAPI): A programming interface that gives engineers direct access to trace records stored in regional Dapper repositories (called "Depots"). This allows teams to build custom analysis tools for their specific needs.
-
The Dapper Web UI: An interactive web-based interface that lets engineers explore traces without writing code. The typical workflow looks like this:
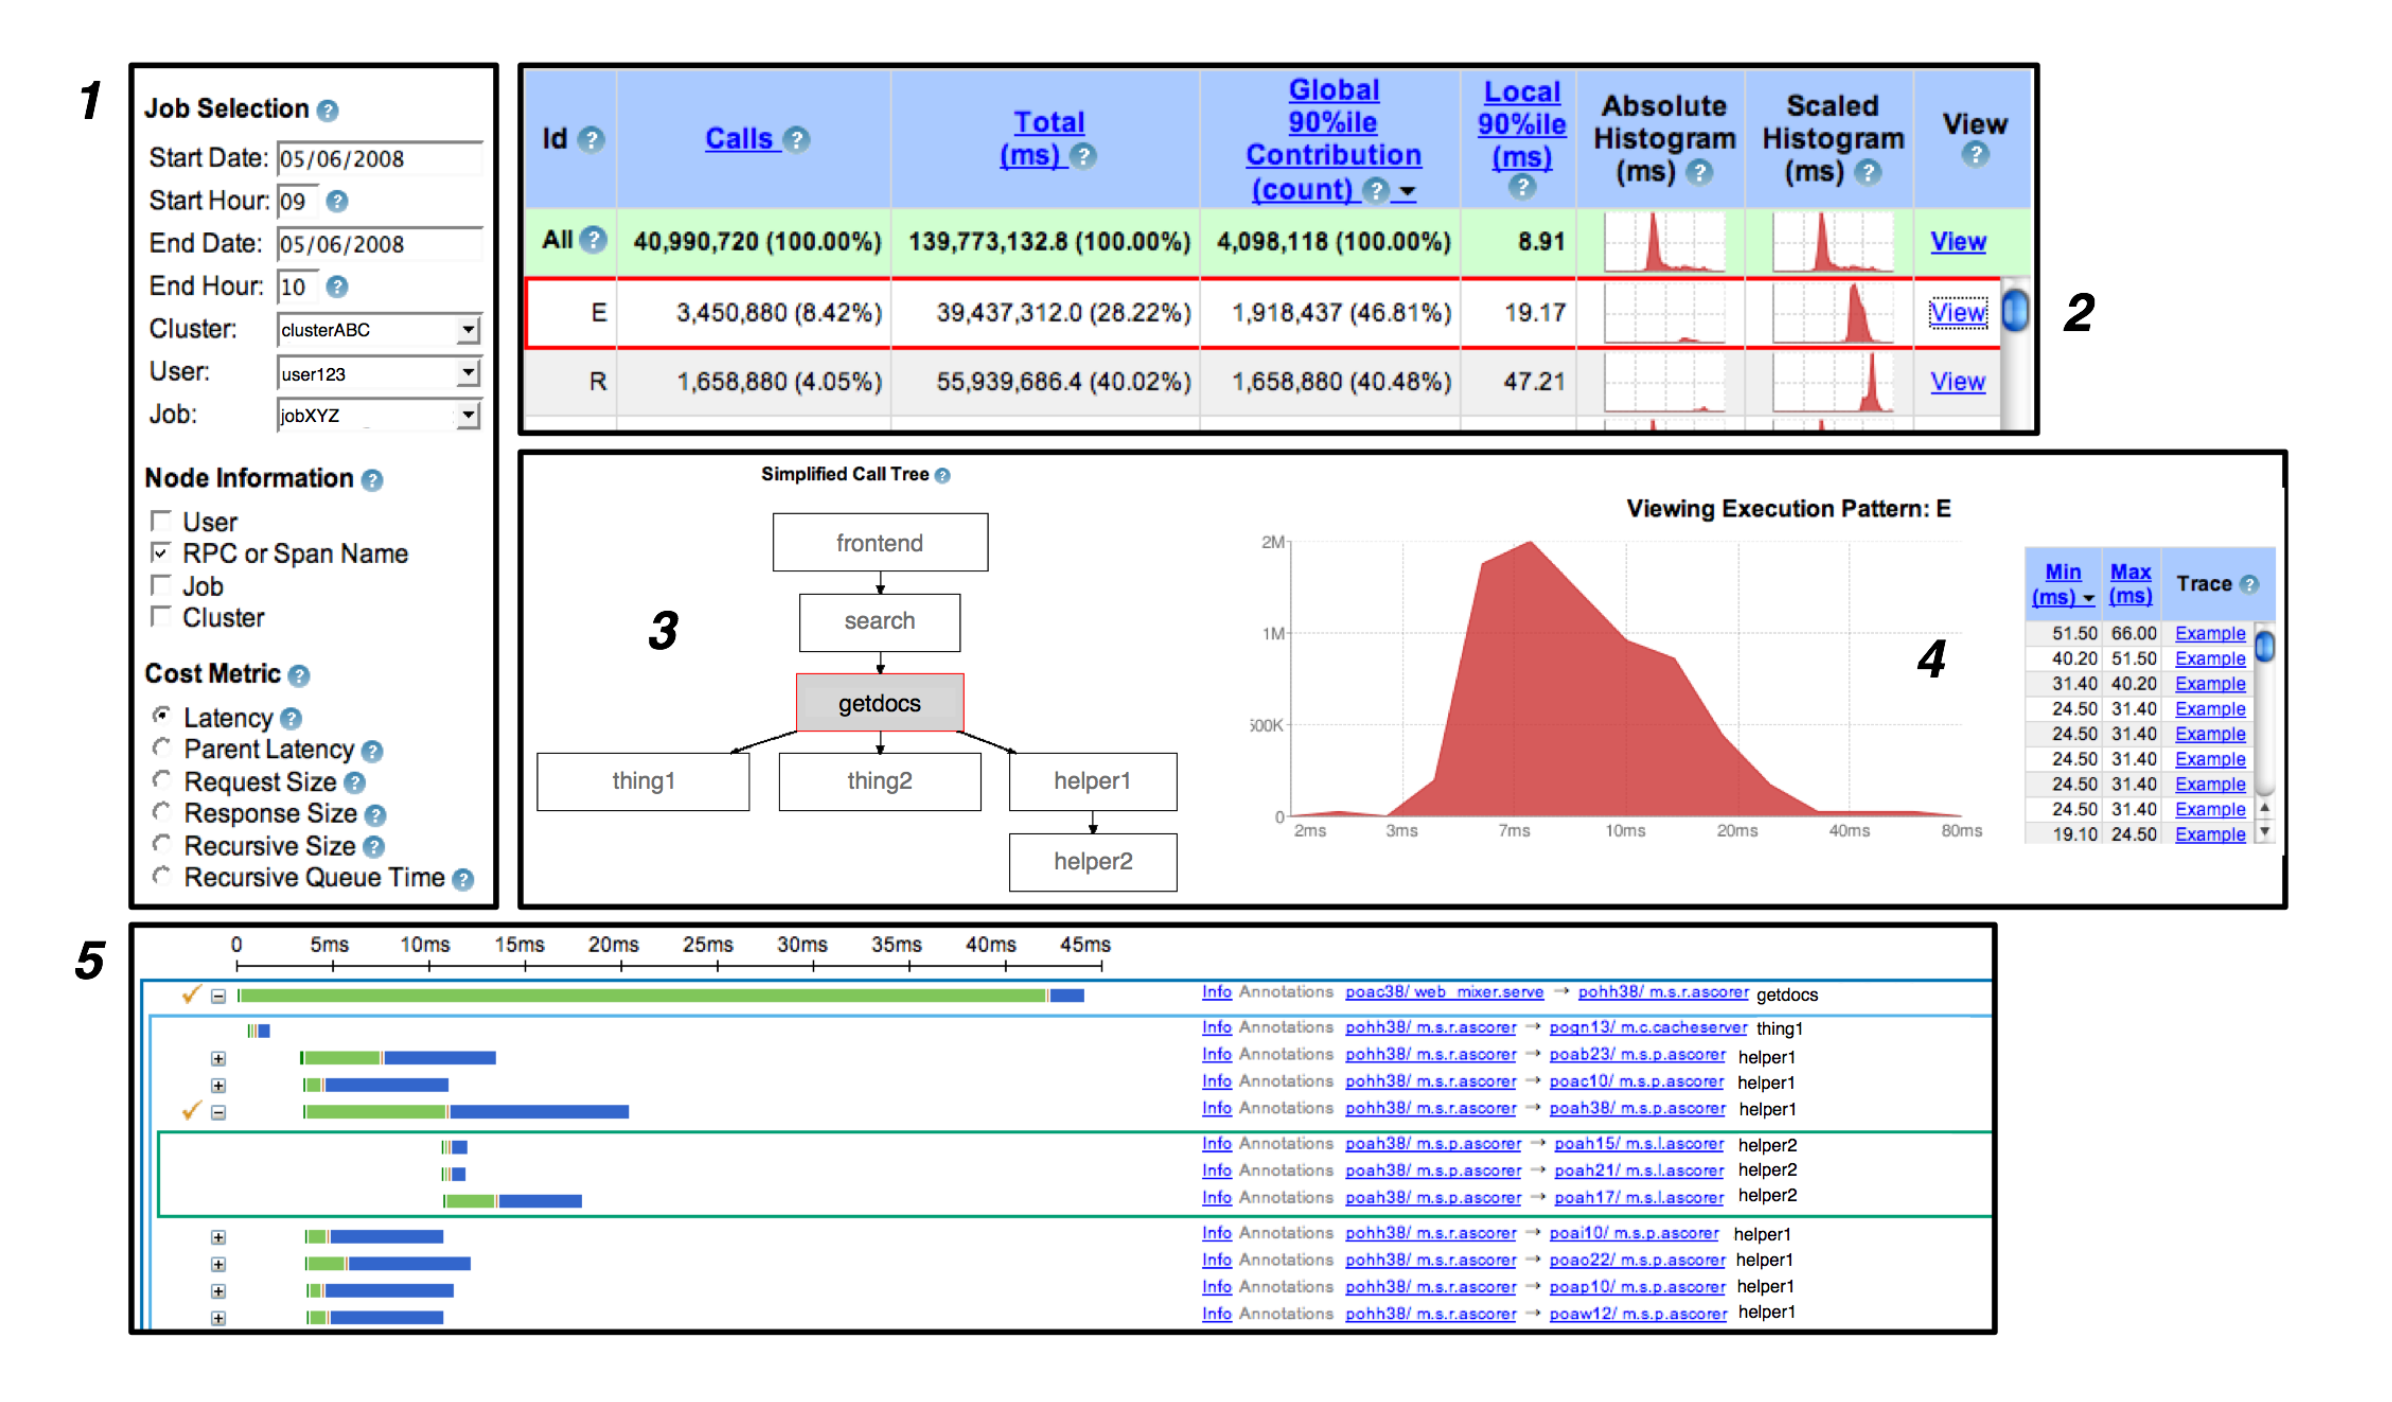
Engineers can search for traces by various criteria (time range, service name, latency threshold), drill down into individual traces to see the complete tree of spans, and identify bottlenecks or errors. The UI makes it easy for anyone to investigate performance issues without needing deep expertise in distributed systems.
Real-World Use Cases
After deploying Dapper across Google's infrastructure for over two years, the team identified several key areas where it proved invaluable:
-
During development: Engineers use Dapper to understand how their new features interact with existing services and to catch performance issues before they reach production.
-
Addressing long tail latency: Sometimes 99% of requests are fast, but 1% are mysteriously slow. Dapper helps identify why those outlier requests are taking so long by showing exactly which services or operations are causing delays.
-
Inferring service dependencies: In a large organization, it's hard to know which services depend on which others. Dapper can automatically map out these dependencies by observing which services call each other, creating a live map of the entire system architecture.
-
Network usage analysis: By analyzing traces, teams can understand which services are making the most network calls and optimize their communication patterns.
-
Layered and shared storage systems: When multiple services share the same storage infrastructure (like Google's Bigtable or file systems), Dapper helps attribute load to specific services and understand how they're impacting each other.
-
Firefighting: When production systems are on fire (experiencing outages or severe performance issues), Dapper provides the first line of defense for quickly diagnosing what's wrong and where.
Lessons Learned and Limitations
After years of production use, the Dapper team identified several important limitations that future distributed tracing systems would need to address:
-
Coalescing effects: Sometimes systems batch multiple requests together for efficiency. For example, instead of writing to disk for every request, a service might buffer 100 requests and write them all at once. When this happens, Dapper might attribute all 100 writes to whichever request happens to trigger the batch operation, making that one request look much slower than it actually is. This can be misleading when debugging.
-
Tracing batch workloads: Dapper was designed for interactive request-response systems (like web search). For offline batch processing jobs (like MapReduce or data analysis pipelines that process terabytes of data), the concept of a single "request" doesn't really apply. The team learned they needed to associate trace IDs with other meaningful units of work, such as data ranges or processing shards, rather than individual requests.
-
Finding root causes: Dapper is excellent at showing you which service is slow, but it doesn't always tell you why. If a database query is taking 5 seconds, Dapper shows you that the database is the bottleneck, but you still need other tools to understand whether it's due to a missing index, lock contention, hardware issues, or something else.
-
Kernel-level information: Dapper traces user-level application code but doesn't capture what's happening at the operating system kernel level (like network packet handling, file system operations, or CPU scheduling). Google has other tools for kernel profiling, but connecting kernel-level events to Dapper's application-level traces proved difficult to do in a clean, non-intrusive way.
These limitations don't diminish Dapper's value - they simply highlight that distributed tracing is one tool in a larger debugging toolkit, not a silver bullet for all performance problems.
Why This Paper Matters
The Dapper paper, published in 2010, fundamentally changed how the industry thinks about observability in distributed systems. Before Dapper, distributed tracing was either too expensive to run at scale, too intrusive (requiring developers to manually add instrumentation), or both.
Dapper proved that you could have it all: comprehensive tracing with minimal overhead, zero developer burden, and deployment across an infrastructure serving billions of users. The key insights - sampling for scalability, instrumentation at the library level for transparency, and the trace/span data model - have become industry standards.
Today, virtually every distributed tracing system (OpenTelemetry, Jaeger, Zipkin, AWS X-Ray, etc.) builds on concepts introduced in this paper. If you've ever debugged a microservices application using distributed tracing, you're using ideas that originated with Dapper.
Performance Stats
To put Dapper's efficiency in perspective:
- The Dapper daemon uses less than 0.3% of one CPU core
- Network overhead is less than 0.01% of Google's total network traffic
- Memory footprint is minimal
- Median data collection latency: under 15 seconds
- Google generated over 1 terabyte of sampled trace data per day (at the time of writing)
These numbers demonstrate that comprehensive observability at massive scale is not just theoretically possible - it's practical.
Over the next few Saturdays, I'll be going through some of the foundational papers in Computer Science, and publishing my notes here. This is #11 in this series.